Guest article written by Ardavan Beigui, co-founder of Tinyclues and originally published in English on Medium.
Since the launch of Tinyclues In 2013, I had the chance to meet more than 3,000 marketers: marketing directors, email campaign managers, CRM managers... from large global corporations to small family-owned companies. During our exchanges, one subject was systematically brought up: the contradiction between the attention marketers pay to their customers (and the idea of "not bothering them"), and what the reality imposes on them on a daily basis:
"We probably send too many messages to our customers, but each message generates revenue, and that's what we're measured on. Our churn rate seems low, our competitors are even more aggressive, and we're under real pressure to perform. So do we have a choice?"
In fact, all marketers face the same dilemma: being "customer centric" while generating revenue, and monitoring fatigue indicators to adjust their marketing operations.
What if the most common indicator of fatigue (churn) was churn rate) was wrong? Could it be that the way we measure measure fatigue is the wrong one?
1re part - What is email fatigue and how to evaluate it? How is it taken into account today in marketers' campaign strategies?
Fatigue can be defined as a decrease in the commitment of your customers over time, due to the messages you send them.
In this respect, it cannot be measured solely by even if customers who unsubscribe from your database are of course expressing a sign of a sign of fatigue (just like customers who "report spam"). spam").
By definition, fatigue is measured by by observing the decline in customer engagement and returns over time. you get. This requires methodical protocols such as observing control groups over control groups over potentially long periods of time, especially if you want to you want to get meaningful statistics. Many companies are willing to pay a high price to evaluate the incremental contribution of a marketing of a marketing channel on their overall revenue. But they are not willing to make the same investment to measure the impact of e-mail fatigue on their of e-mail fatigue on their customers. This is understandable, since marketers are almost systematically evaluated on the on the revenue and engagement they generate right away NOT on the fatigue they avoid or their current contribution to future revenue. contribution to tomorrow's revenue.
Unfortunately, since churn is the only fatigue indicator instantly available in most email campaignsIt has become the "default" indicator of fatigue for each campaign.
I often ask the following questions to marketers:
1.1 - "What is your churn rate and what do you think about it?"
The answer is usually: "Churn rates are pretty low, less than 0.1 %. Our customers don't seem to be bothered by our messages. by the messages we send them."
In fact, churn rates appear to be systematically This makes them difficult to compare from one campaign to another. This makes them difficult to compare from one campaign to another; you may have to look at three look at three decimal places to notice a difference. This leads many marketers to think that fatigue is "under control" and that churn and that churn rates are "stable".
This is misleading, however, because churn defined as the ratio between the number of unsubscribes and the number of messages number of messages sent, is an indicator of superficial (see below). below).
1.2 - "When a customer unsubscribes from your base, do you know what future revenue is lost? Can you put a number on the value of a contact who unsubscribes?"
In 99% of the cases, the answer is: "Not not really". Many marketers have built CLV (Customer (Customer Lifetime Value) models, but very often these models do not include churn. As a result, most marketers cannot know exactly the loss of future income caused by a unsubscribing.
A marketer once explained to me how his company tries to estimate this value. They look at the average revenue generated over 12 months by a registered customer who receives weekly messages. Then they estimate for each unsubscribe the average revenue lost over the 12 months following the unsubscribe. In their case, the amount is 200 $ (since emailings generate a lot of traffic to their site).
If a campaign generates an unsubscribe rate of 0.1 % on a base of 3M subscribers, that's 3,000 customers who no longer receive emails following a single campaign. In the example above, that's 3,000 X 200 $, or 600,000 $ of future lost revenue, as a direct consequence of a single campaign. If there was a way to lower this rate from 0.1 % to 0.07 % (without loss of revenue), it would prevent 900 unsubscribes, or save 180,000 $ of future revenue.
Maybe your subscriber base is not 3M, but 1M. Perhaps you have already estimated that your e-mailing operations do not generate 200 $ of revenue per customer per year but rather 25 $. A churn rate of 0.1 % per e-mailing sent therefore amounts to 1,000 customers that you can no longer contact, or 25,000 $ of lost revenue for the next 12 months. Is this negligible?
Bonus info: Let's look at this so-called "low churn rate" from another angle. Let's say we have a base of 3M subscribers and a churn rate of 0.1 % for each e-mailing sent. At the rate of 2 e-mailings per week (or 100 over 12 months), about 300,000 customers will have disappeared from our base - that's about 10 % (if you got your calculator out, the exact figure is 285,624 unsubscribed contacts!). That's high, but again we may not realize it: thanks to new customers signing up via acquisition efforts, if the total number of registrants stays around 3M, an illusion of stability remains.
1.3 - "How often do you send communications and for what reason?"
The answers are generally along these lines: the frequency depends on "industry and competition benchmarks", "habit" and "the level of email activity of each client". Frequency varies by industry: clothing brands typically send 3 to 5 messages per week. Sales sites that work with flash sales and promotions send messages daily (and sometimes more!). And many travel agencies (except discount) send 2 to 3 messages per week (sometimes less).
Many marketers adjust this frequency of sending according to activity of their customers: some messages are only sent to those who have shown messages are only sent to those who have been engaged in the last 90 days, even more days, even more engaged customers may receive more messages, etc. messages, etc. This approach improves deliverability rather than reduces fatigue. It also leads to a reduction in the size of the base over time via a Pygmalion effect effect (the more messages customers receive, the more they engage, the less they receive, the the less they receive, the less they engage).
And when I ask the question, "How do you have you come toThe best answer I get is: "We did focus groups 2 years ago and realized that sending more than 3 messages a week was problematic because the following messages led to a lot of unsubscribes. Good point! However, the study is 2 years old and things may have changed since then... As these tests are not repeated every year, they are not up to date. In reality, in most cases, the answer is rather: "This is what we have been doing for some time and today we have other priorities than investing in reducing e-mail fatigue".
1.4 - "If your campaigns aren't generating fatigue and you're sending 3 (or 5 or 10) weekly communications, why not double or triple that frequency?"
Of course, the point is to provoke debate. debate. But this question underscores an important point: marketers marketers know they are generating fatigue, even if the churn rate doesn't always show it. shows it. We soaps than not everyone is interested in our messages, but it is easier to send them anyway, to to send them anyway, to avoid potentially missing out on revenue. revenue.
One of the main reasons sending 15 campaigns a week is a challenge is that it's very difficult to target campaigns effectively, and to go beyond basic segmentation or affinity models. If we could go from 5 to 15 campaigns and measure a real increase in engagement and decrease in unsubscribes, obviously we would all do it.
2e part - Missing indicators to assess fatigue
Here are the results of 3 campaigns sent by an online retailer to his customer base.
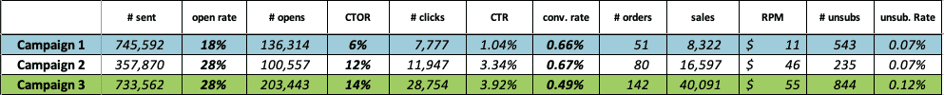
Let's take a look at Campaign 1:
- 745,592 e-mails sent.
- 136,314 openings, for an opening rate of 18 % (136,314 out of 745,592).
- 7,777 customers clicked to go to the site, which is a reactivity of 6 % (the reactivity corresponds to the openers having clicked, i.e. 7,777 out of 136,314). The click-through rate is 1.04 % based on the number of messages sent (7,777 out of 745,591).
- According to the attribution rules of this company, 51 orders were counted, for a conversion rate for visits of 0.66 % (51 out of 7,777).
- These 51 orders generated 8,322 $ of sales.
- The RPM (revenue per message) is 0.011 $ (8,322 $ out of 745,592 sends). The table above shows the revenue per 1,000 messages, or 11 $ (marketers analyze the numbers in different ways).
- 543 people unsubscribed, which represents 0.07 % of the customers who received the message (543 out of 745,592).
If we compare campaigns 1 and 3, we see that Campaign 1 has a lower churn rate (40 % less). This e-mail has therefore generated less fatigue than campaign 3... But is this really the case? the case? And how can we compare campaigns 1 and 2, which have the same churn rate of 0.07 %?
These questions cannot be answered with the available indicators, as there is no way to assess the fatigue generated by a campaign versus the positive that it brings (engagement and sales). Unsubscribes are usually measured in relation to the number of messages sent, which is problematic: if we created an algorithm to optimize this unsubscribe rate, it would recommend sending messages to those who don't open the emails, and therefore cannot unsubscribe. Would this be wise?
What if instead of looking at the number of messages sent messages sent, what if we looked further into the indicators that interest us? of interest? Like:
- The openings
- Visits (clicks)
- The transactions
- The revenue generated
Let's look at how this would change our paradigm.
2.1 - Churn to opening ratio
Let's go back to our 3 campaigns, we have introduced one more indicator in the last column on the right: the "Churn/Opening Ratio":

This indicator measures the damage caused by the campaign on the clients who have view. One of its many advantages is that it highlights campaigns with a purpose misleadingThis means that customers will open the e-mail, but the content will be unsatisfactory and the "unsubscribe/open ratio" will soar.
Let's compare these 3 campaigns with this new angle.
- Campaigns 1 and 3 are relatively close: 0.4 % means that for every 250 customers who saw the message, 1 unsubscribed.
- Campaign 2 does better: 0.23 % means that for every 430 customers who saw the message, 1 unsubscribed.
This is a a very different reading!
2.2 - Unsubscribe / click ratio

The unsubscribe-to-click rate is the ratio of unsubscribes to the total number of clicks (or visits to the site) drained by the campaign. For campaign 1, it is 543 out of 7,777, or 7 %.
For every 100 clicks on the campaign 1.7 unsubscribes are counted. This indicator reveals the cost of generating generate traffic to the site.
The 3 campaigns can be analyzed once again differently: for each engagement generated, it is campaign 1 that is the most is the most damaging, while campaign 3 is less than half the size of campaign campaign 1. Campaign 2 wins by generating only 2 unsubscribes per 100 visits.
So, which campaign causes the most fatigue? Before we answer that question, let's add one last indicator to our analysis.
2.3 - Revenue generated by unsubscribing

While this indicator may seem strange, its formula is simple formula is simple: divide the revenue generated by the number of unsubscribes. It thus measures the revenue generated by each campaign each time it results in 1 unsubscribe from the base. It is therefore an indicator that should be to maximize.
- For every 15 $ generated by campaign 1, there is 1 churn.
- Campaign 3 does 3 times better: for each unsubscribe, 48 $ of revenue is recorded.
- Campaign 2 wins, with 71 $ for each unsubscribe.
Bonus info: this indicator can also be considered as an approximation of the "Lifetime customer value via the email channel. Let's say your average campaign value is 50 $ of revenue for 1 unsubscribe. That means you are willing to trade 50 $ for 1 unsubscribe. If your base consists of 3M customers, that means that in a way, you are willing to trade your right to send them emails for a total of 50 $ X 3M, or 150M $. In any case, it means that with the current fatigue generated by your campaigns, your 3M customer base CANNOT generate more than 150M $ via your email campaigns. So, if you are currently running campaigns with the performance level of campaign 1, and you could improve them by reaching the performance level of campaign 3, this "remaining lifetime revenue generated by e-mailing" would increase from 150M $ to 480M $... Not bad!
3e part - What to conclude from all this?
While assessing fatigue is a painstaking and complicated process that takes time complicated and time-consuming (and sometimes impossible!) process, this article offers an alternative, pragmatic approach that can change the way you analyze a campaign and which you you decide on next. The traditional "churn rate" is an indicator low because marketers are less concerned with the number of messages they send than with the the engagement (openings, clicks) and sales.
This is why it is fundamental to evaluate the churn in relation to engagement and sales. The numbers are more meaningful, easier to compare and do not all seem infinitesimally small and infinitely small and negligible.
In the end, which campaign generated the most fatigue? Let's look at the ranking according to the rate we're interested in.
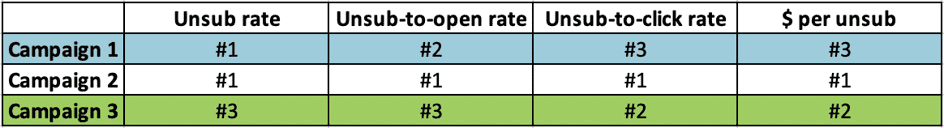
The campaign 2 wins hands down.
The campaign 1, which seems to be the big winner if we look at the traditional churn rate, turns out to be the loser if you look at churn rate vs. churn rate versus clicks or revenue generated for each churn. unsubscribe. This campaign scores poorly on fatigue versus revenue generated, with a ratio of "revenue for each unsubscribe" 3 times lower than unsubscribe" ratio 3 times lower than campaign 3 and 5 times lower than campaign 2. than campaign 2. Either this campaign is fundamentally wrong, or it didn't target the right customers.
The campaign 3, which is the loser according to traditional indicators, ranks second and second place and is proving to be a strong campaign. With 844 unsubscribes, one might think that it didn't perform very well compared to campaign 1 (543 campaign 1 (543 churn, or 55 % more unsubscribes)... Yet this campaign generates 382 % more income. It is therefore undoubtedly a better campaign if we follow a business logic. But the classic churn rate does not show this; it rather points to the opposite and thus misleads us. misleads us.
Finally, which indicator should you focus on? It's up to you to decide, but here are some tips tips:
Whatever you do, DO NOT DO NOT limit yourself to the traditional and obsolete churn rate.
- If your campaign is designed to give visibility to your brandLook at the churn rate versus the open rate. It answers the question: "What proportion of customers are annoyed by what they see?
- If your campaign aims to generate visits on your site, look at the unsubscribe rate versus clicks.
- And if, as for most marketers, the objective of your campaign is above all to generate incomeLook at the revenue generated for each unsubscribe. This is a great way to analyze a campaign and determine if it is too damaging for the revenue it generates.
Note: the first two KPIs can only be observed with data from your emailing tool (unsubscribe vs. open rate and unsubscribe vs. click rate). For the third, it is necessary to reconcile transaction data and email data.
Add to your your dashboards these 3 simple indicators, and review them regularly as part of your weekly campaign performance meeting will provide performance meeting, will give you valuable insight into your campaign's damages that your campaigns drive in relation to engagement metrics that matter to you (views, visits or sales). or sales). This allows you to highlight effective campaigns to continue and to be continued and accentuated, and to detect those that are not working and need to be reconsidered. The results are sometimes surprising!
Finally, an undeniable advantage is to discover for yourself how to go further in your marketing strategy marketing strategy without causing fatigue. This allows you to understand, based on your own based on your own data that fatigue has nothing to do with the frequency of sending messages but rather everything to do with to do with the repeated sending of irrelevant messages. Indeed tto keep your messages relevant, your customers will appreciate receiving them. And if you don't have to take my word for it take my word for it, you can now see for yourself!
To learn more about how to implement these principles or about the issues addressed, join me on LinkedIn or send me an e-mail at ard@tinyclues.com.
-
This article on e-mail fatigue is the first of three to be published over the next few weeks. It discusses positive changes that marketers can immediately implement, at no cost, simply by analyzing their e-mail campaigns from a different perspective. The next article shows how the behemoth Amazon has hurt (insidiously) marketers in the way they build their campaign strategies, and what they can change. Finally, the last article will focus on how marketers can build bold campaign strategies that are driven by business objectives and that generate great results.
Leave a Reply