Measure the statistical performance of your email campaigns and compare your indicators to other players in your market is inevitably important. So there's nothing like a good emailing benchmark. Unfortunately, we can't, obtaining objective statistics is no easy task.
Generally, emailing benchmarks are created by emailing tools themselves. These tools compile statistics on their customers. It is therefore important to note that each benchmark has its own specificities In short, from one benchmark to another, there can be a wide range of results. So we've decided to compile a list, just for you, a list of the best emailing benchmarks of the market!
This article is freely available.
It took time and expertise!
This month, thanks to our customer-sponsors: Actito, BPI France, Cardif, Citeo, Clarins, CMI France, Editis, Engie, France Télévisions, Le Parisien, Les Echos, Les Furets, Pierre Fabre, UMR, Voyageurs du monde... Thanks to the missions they entrust to us, we can write and share free content. They support our educational work to promote more responsible email. Become a customer and benefit from our expertise while supporting the production of open knowledge.
Elements of email benchmark methodology
Before making comparisons with your own emailing statistics, it's a good idea to check a few methodological points, especially the way rates are calculated in the studies you read.
For example the meaning of the term "click-through rate" in email marketing can vary widely from one platform to another. We can talk about clicker rate, cumulative click rate, reactivity rate, CTOR (Click-to-open rate), click-rate, click-through rate, etc.
Similarly, depending on the email marketing solution, the click-through rate may or may not include clicks on unsubscribe links. Be relative to the number of emails sent or the number of emails delivered. Sometimes click rates are confused with reactivity rates (clickers/openers)...
Also, the statistics differ according to the authors of the benchmarks. Some specialize in sending prospecting emails to cold prospects. Others base their calculations on newsletters sent to active subscribers.
In short, be sure to compare apples with apples !
Finally, it is sometimes interesting to looking beyond "averages. The few studies that do use medians or quartiles are often much more rigorous in their treatment of the data. And while your statistics courses may have given you a knack for studying, it's essential to understand that statistics can provide essential insights.
Table of contents
- Elements of email benchmark methodology
- Quantitative studies: How can you compare your email campaign statistics?
- Mailmodo 2026: KPIs, the role of AI in email creation and interactive emails
- Litmus: State of Email Report 2026
- Benchmark 2025 by Brevo: Email KPIS and omnichannel trends
- Benchmark of email marketing 2024 by Inxmail
- Email Marketing Benchmark 2022 by Campaign Monitor
- B2B: Barometer 2025 of prospecting email sequences by Nomination
- B2B: 2023 Barometer of prospecting emails by Nomination
- Ecommerce Email Benchmark 2024 by industry by Klaviyo
- International Benchmark 2025 by GDMA
- Emailing barometer of ecommerce 2022 by Kiliba
- Quantitative emailing studies that have outlived their usefulness
- Benchmark for Push App, Push Web and In-App Notifications
- Qualitative studies: Benchmarks in email practices and usage
- Deliverability barometers
- Finally, about benchmark emails
Live : Benchmark emailing 2023. Badsender gives you statistical benchmarks
Watch the replay (in low definition please)
Listen: subscribe to the "Badsender" podcast on your listening platform
Quantitative studies: How can you compare your email campaign statistics?
When it comes to benchmarks dedicated to the results of emailing campaignsIt's a big world out there. Unfortunately, the main studies are American, and European figures are rare and not necessarily up to date.
The idea here is to offer you the most relevant sources of information, but we may have missed the study of the year. If you have any suggestions, do not hesitate to contact us.
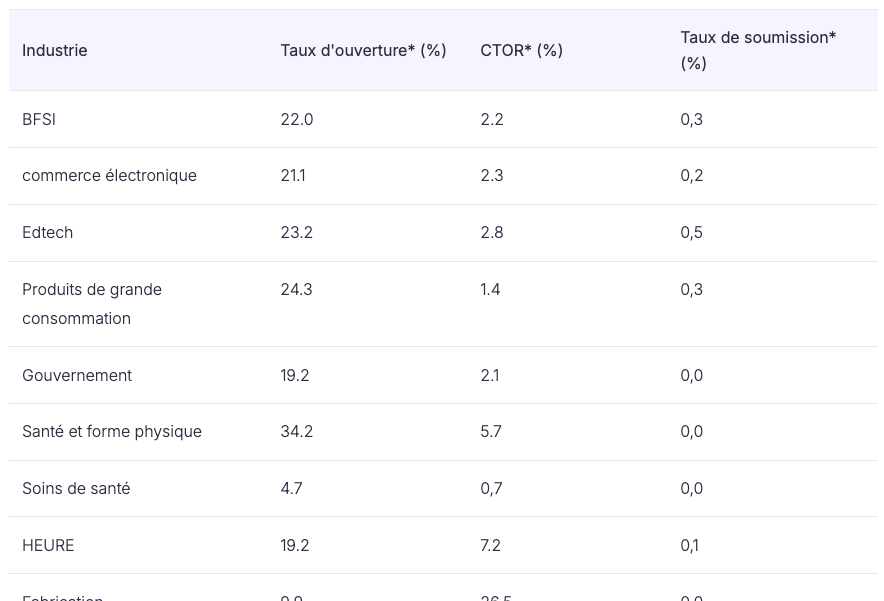
Mailmodo 2026: KPIs, the role of AI in email creation and interactive emails
In its recent «State of Email 2026» 2025, Mailmodo surveyed 94 marketing professionals, mainly from the USA, Europe and Southeast Asia.
Even if the volume of respondents is very modest, some of the information is interesting. But it should be taken with a grain of salt.
The main findings of the Mailmodo Report :
- Email remains in the top 1 of channels, with 26.7% of respondents citing it as the best-performing channel, ahead of organic search (23.3%) and organic social (12.2%).
- Average opening rate: between 20-30%. Some sectors perform better, as shown in the table below.
- Nothing is said about the click-through rate, but they put forward the CTOR (Clic to open rate, the equivalent of the reactivity rate in French).
- The length of an object with the highest open rate is between 81 and 100 characters.
- If emoji in the object, the average opening rate is 29%, otherwise 21%.
- Average mailing frequency: 1 to 4 campaigns per month for the most part
- Best days: Tuesday and Thursday top the list, but all days perform well (especially Sunday! and I've seen that with BtoC targets too).
What tools are used to create the emails?
- 42.9% are assisted by an RN
- 28.6% through their routing tool's email builder
- 28.6% by a third-party email builder
Email marketers know less and less how to do without AI to write emails:
- 42.9% use AI as a creative aid
- 27.3% write directly via IA
- 54.5% combine AI and copywriter
- Only 18.2% rely solely on a copywriter.
Download the benchmark : https://www.mailmodo.com/ebook/state-of-email/2026/
Litmus: State of Email Report 2026
AI has slipped in between the sender and the recipient. Gemini now integrates Gmail to sort, summarize, and filter emails on behalf of subscribers. Emails with no real value will be discarded — yet, fewer than a third of marketers have a strategy adapted to these new AI-driven inboxes.
The main takeaways:
- AI :
- 35 % des marketeurs citent l’IA comme priorité numéro un au recrutement
- Advanced AI adopters are 28 % more likely to deploy an email in less than a day
- Early adopters of AI are 75 % more likely to achieve a higher ROI
- APAC companies are 63 % more likely to achieve ROI with a more cautious AI adoption
- Production :
- 76 % des équipes produisent une campagne en moins de 3 jours
- 1 in 3 marketers needs 4 to 6 tools to send an email
- Newsletters are up 12 % vs 2025 vs promotional emails
- Return on Investment Companies with the best ROI (45:1) focus on relationship emails: newsletters and onboarding.
- Accessibility Only 26 % follow WCAG standards. Only 21 % comply with the EAA (European Accessibility Act, in force since 2025).
- Average open rate : between 30 and 40%
- Average click-through rate : between 3 and 5%
Important note on the open rate Since Apple's Mail Privacy Protection (MPP), the open rate is a directional signal, not an absolute metric. It's just useful for comparison.
Download the benchmark : https://www.litmus.com/landing-page/state-of-email-2026
Benchmark 2025 by Brevo: Email KPIS and omnichannel trends
The Brevo 2025 benchmark is based on the analysis of 11.9 billion emails sent in 2024 by over 19,000 Brevo corporate customers. The data comes mainly from France, and tends to concern small and medium-sized businesses, although Brevo is currently developing its business with large accounts.
Download the benchmark : https://www.brevo.com/fr/resources/brevo-marketing-benchmark/
The main findings of the Brevo 2025 benchmark :
- Average opening rate: 33.90%
- Average click-through rate: 4.32%
- Average unsubscription rate: 0.41%
- Average deliverability rate: 96.29%
The benchmark breaks down results by company size and business sector.

The most successful sectors for email marketing are :
Highest click-through rates :
- NGO
- Public authorities
- Tech
Lowest unsubscribe rates :
- Finance
- Public administration
The sectors in greatest difficulty are :
Lowest click-through rates :
- Ecommerce and retail
- Travel & Tourism
- Health
Highest unsubscription rates :
- E-commerce
- Real estate
- Construction
Email alone shows diminishing returns. With inboxes becoming increasingly saturated, emailing alone is no longer enough. Successful companies are adopting a multi-channel approach, where each channel (email, SMS / RCSWhatsapp, push notifications and mobile wallets) plays a strategic role in the customer journey.
Benchmark of email marketing 2024 by Inxmail
About data The study is based on a total of 4.3 billion emails sent over 297,600 different campaigns by 1,061 different senders. 55.9% of these emails were sent to B2B targets, and 44.1% to B2C targets. The emails analyzed were sent between January 1 and December 31, 2023. The data comes mainly from the DACH markets (Germany, Austria and Switzerland).
Download the benchmark : https://newsletter.inxmail.fr/benchmark.jsp
Key figures :
| B2B | B2C | |
| Median frequency of mailings per month | 3 | 6 |
| Median opening rate | 22,8% | 23,5% |
| Median click-through rate | 3,2% | 3,6% |
| Median bounce rate | 0,9% | 0,3% |
The study's interesting statistic : This is an extremely detailed emailing study, with an impressive amount of data. It should be noted, however, that the data is mainly German. Its richness lies, among other things, in the clear distinction between B2B and B2C campaigns, and the wealth of information linked to business sectors. We've therefore included a comparative table based on business sectors. For the rest, download the full report.

Email Marketing Benchmark 2022 by Campaign Monitor
About data The data presented in this benchmark comes from all the emails sent by the Marigold group (of which Campaign Monitor is a member) over the year 2021. The study is based on over 100 billion emails sent. The companies in the Marigold group are highly diversified. This means that there are both small companies and large groups from all over the world.
To access the benchmark : https://www.campaignmonitor.com/resources/guides/email-marketing-benchmarks/
Key figures :
- Average opening rate: 21.5%
- Average click-through rate: 2.3%
- Average reactivity rate: 10.5%
- Average unsubscription rate: 0.1%
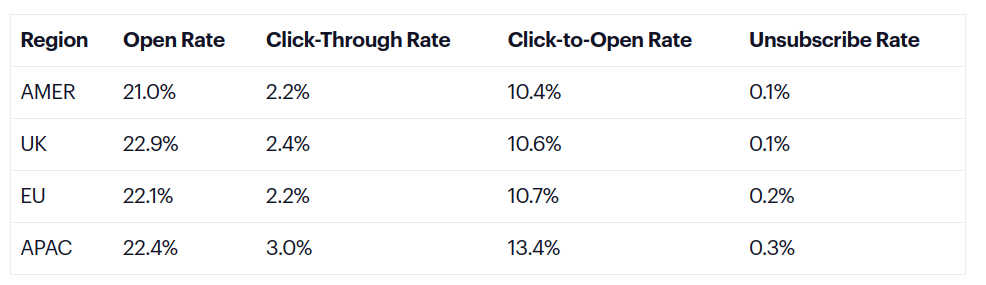
The interesting statistic from the study: Campaign Monitor's benchmark has the advantage of using an extremely large volume of data (even if we'd like more recent data). This gives it a good representation of email statistics by industry. But what we particularly like are the statistics by continent (in a future version, it would be nice to have a view by country).
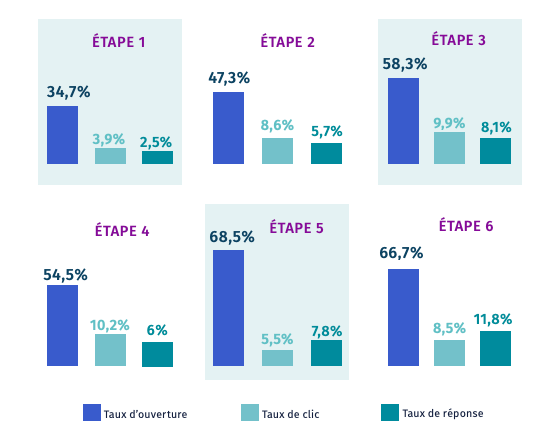
B2B: Barometer 2025 of prospecting email sequences by Nomination
About data Contrary to one-off emails sent to an entire
data, emailing sequences are based on a structured, multi-stage scenario. In this barometer of emailing sequences, Nomination analyzed the 1,526 sequences sent by its 238 corporate customers in 2024, i.e. 1,062,234 emails sent to 426,948 decision-makers.
Download the benchmark : https://www.nomination.fr/livres-blancs/barometre-sequences-emailing-2024/
Key lessons :
- An emailing sequence offers 4.5 times more response opportunities than a one-off email
- A 5-6-step prospecting sequence offers better performance
- Messages should follow an editorial thread and add value to each mailing. The more we talk about their issues and give advice, the better the response.
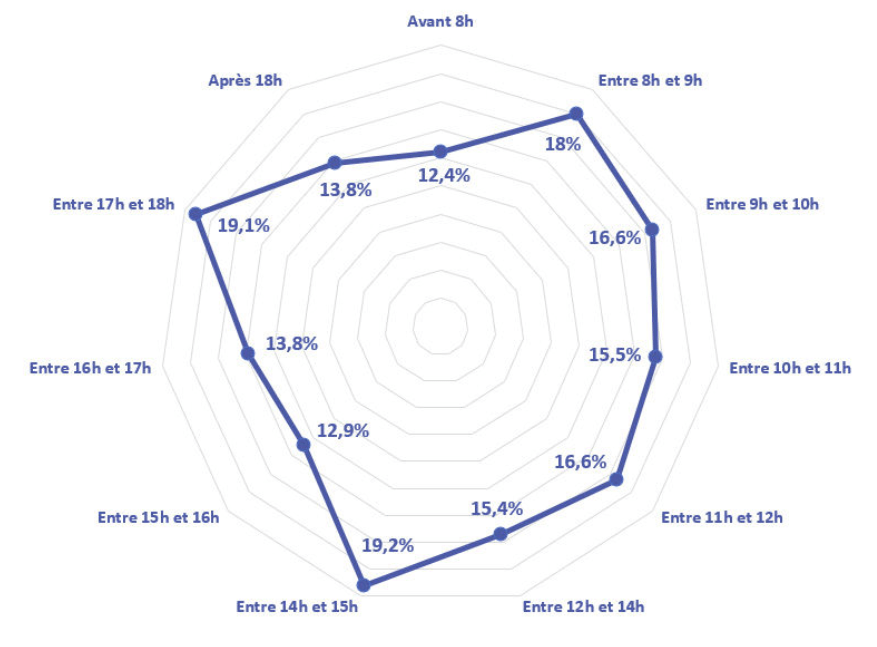
B2B: 2023 Barometer of prospecting emails by Nomination
About data : In this emailing barometer dedicated to B2B, Nomination analyzes the results of 1,852 campaigns sent by 182 customers in 2022, representing a total of over 3 million emails. Nomination's customers are exclusively French and run prospecting campaigns.
Download the barometer : https://www.nomination.fr/livres-blancs/barometre-emailing-btob-2023/
Key figures :
- Average deliverability rate: 95%
- Average opening rate: 16.5%
- Average click-through rate: 2.6%
- Average reactivity rate: 25%
The interesting statistic from the study: There's a lot of interesting information in this emailing barometer dedicated to B2B. Particularly noteworthy is a radar diagram showing open rates as a function of email sending times. It highlights the times when people return to work (after lunch, when they arrive at work in the morning) and at the end of the day before leaving the office.
Ecommerce Email Benchmark 2024 by industry by Klaviyo
About data : Unfortunately, there is little information on the methodology used to collect and process the data in this study. All we know is that the data are averages for their 100,000 paying customers. This should guarantee a good level of representativeness. Our customers Klaviyo are almost exclusively active in ecommerce. Finally, Klaviyo operates internationally, but North America must be over-represented in the data.
To access the benchmark : https://www.klaviyo.com/marketing-resources/email-benchmarks-by-industry
Key figures :
- Average opening rate: 39.74%
- Average click-through rate: 1.47%
- Average conversion rate: 0.09%
- Churn rate: 0.33%
- Average revenue per recipient: 0.11 $
The interesting statistic from the study: What's particularly interesting in Klaviyo's study are the figures by business sector (apparel, automotive, electronics, health, jewelry, ...) crossed with campaign typology (campaigns, welcome scenarios, cart abandonment, post-purchase scenarios, ...). Data includes not only traditional open rates and click-through rates, but also conversion rates and average revenue generated per recipient.
Welcome scenario statistics

Email statistics Cart abandonment

Email retargeting statistics

Post-purchase scenario statistics

Income by scenario

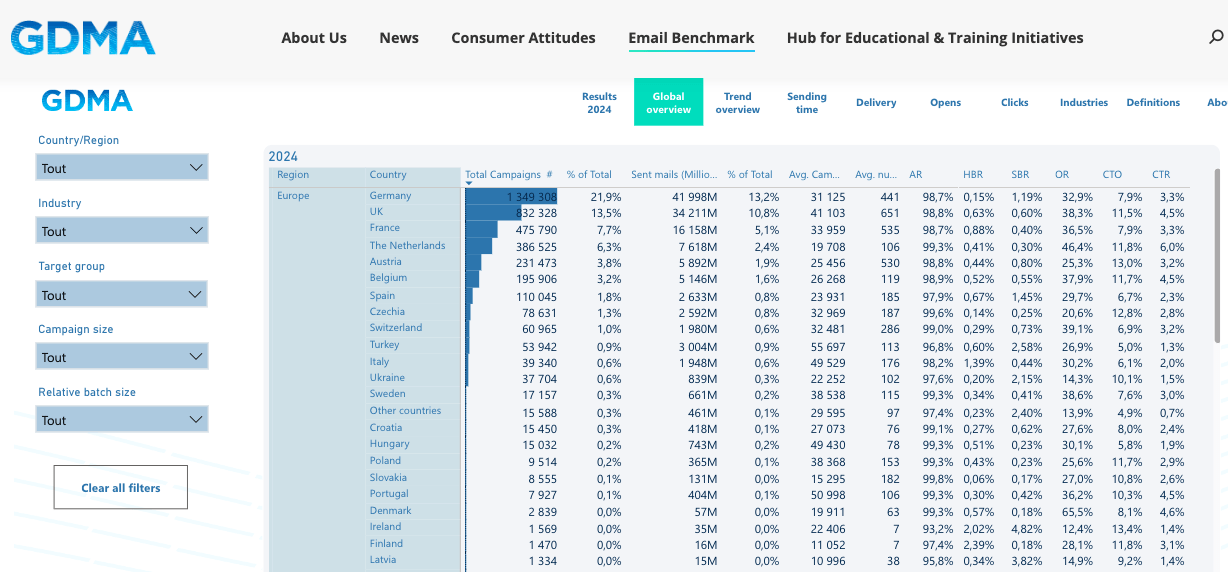
International Benchmark 2025 by GDMA
A major study covering more than 60 countries!
It includes the classic KPIs (deliverability, open, click), sending time (day, month, time), but not unsubscribe and complaint rates.
The tool allows detailed zooming in on each of the 3 indicators.
You can manipulate the data by browsing the tabs in the top right-hand corner, as you would in a Tableau-style BI tool, filtering by world region, country, business sector, target, campaign size,
One thing's for sure: if you're a major international account, it's worth taking a look to compare the performance of your different countries!
Please note, however, that statistics for the French market are not yet available from French routers. French data are mainly from foreign providers operating in France, which may not perfectly reflect local specificities.
Another incredible and rare thing: the study is freely accessible (and we love that at Badsender!). https://globaldma.com/international-email-benchmark/
Emailing barometer of ecommerce 2022 by Kiliba
About data The emailing statistics presented in this barometer are based on all the emailing campaigns sent by Kiliba's 467 customers in 2021. These customers are all French e-tailers.
To download the barometer : https://www.kiliba.com/blog/barometre-2022-decouvre-chiffres-emailing-pour-e-commercants
Quantitative emailing studies that have outlived their usefulness
Rather than completely removing the oldest studies from this article, we preferred to keep them for the archive:
- Marketing Benchmark Study 2018 by IBM Watson : It was undoubtedly the most comprehensive study of email marketing performance. But no longer updated since 2018.
- Email Marketing Benchmark 2021 by Mailpro : Interesting study for its analysis of email typologies, but doesn't seem to have been updated since 2021.
- Global email benchmark report 2018 by Sendgrid The latest Sendgrid benchmark dates back to 2018.
- Email Marketing Benchmark by Mailchimp Mailchimp's barometer figures date back to 2019, although they are still used by many brands to compare themselves with their competitors.
- State of Engagement 2021 by Litmus In the past, Litmus published a study on engagement, but since 2021 this has no longer been the case.
- Email routing business in France 2023 by DMA France
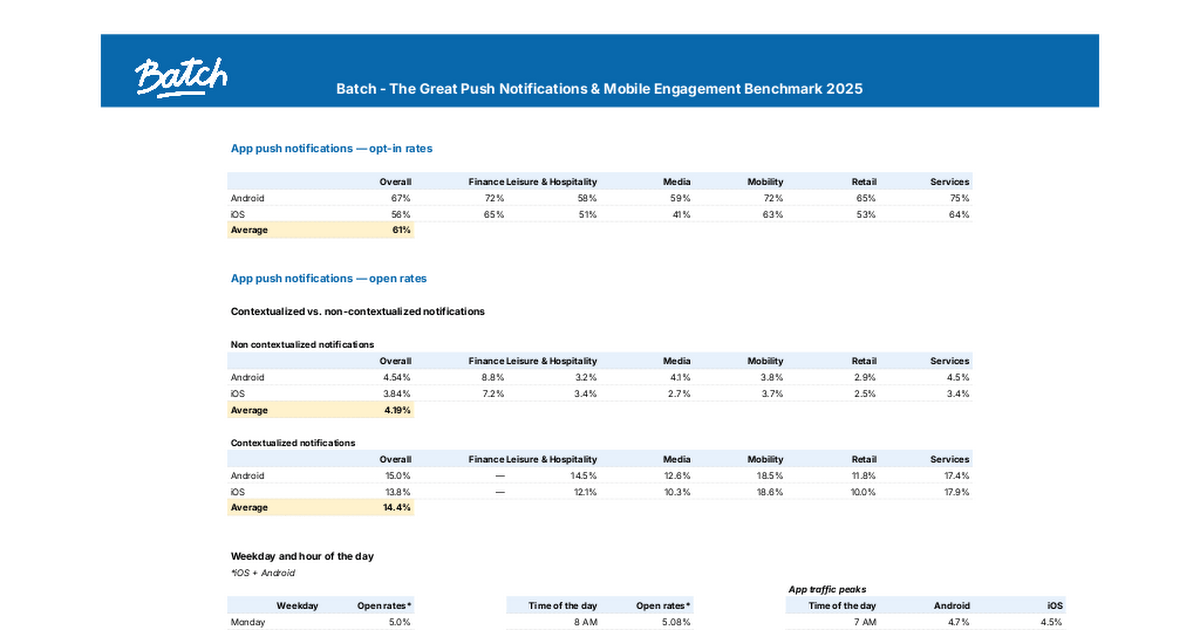
Benchmark for Push App, Push Web and In-App Notifications
About data Batch: Batch releases its benchmark for Push App Notifications, Push Web and In-App Messages for the finance, leisure, media, retail, mobility and services sectors. 800 billion messages sent between July 2024 and July 2025 to more than 1.2 billion unique visitors worldwide via 10,000 apps (iOS/Android) and mobile websites.
Key figures :
- 61% average opt-in rate for push notifications
- Contextualized or segmented pushes open 3.4 times more than generic pushes
- Click-through rates for in-app pushes are better in popup format
- The opt-in rate for web push notifications is 3%
What's interesting about the study It would be very interesting to cross-reference email and push notification statistics. Is it a complementary channel or one that replaces email when a contact becomes inactive on the latter?
Download the report : https://batch.com/fr/ressources/etudes/barometre-notifications-push-crm-mobile-2022
Qualitative studies: Benchmarks in email practices and usage
Average open rates are great! But it's also essential to understand how your recipients perceive email, to perceive trends in the sector, to know the conditions under which messages are opened... It's therefore necessary to leave a little room for qualitative studies, and not just quantitative ones.
Email Client Market Share and Popularity June 2023 by Litmus
About data : This study is in fact rather quantitative, but it clearly reflects email practices and usages. It has the advantage of being updated every month. At the time of writing, data for June 2023 is available, based on 1.4 billion opens by users of Litmus' analytics solution.
To access the study : https://www.litmus.com/email-client-market-share
Key figures The whole study looks at the distribution of open rates by email client. This gives us an idea of which e-mail clients are the most important to invest time and quality control work on during the email template development. Don't forget that these figures vary considerably from one target to another. The ideal is toanalyze the distribution of email customers on your own target. Here are the top 10 in June 2023 (feel free to go to their site for the latest results and see the evolution curves):
- Apple : 58,55%
- Gmail : 28,17%
- Outlook: 4.33%
- Yahoo! Mail: 2.75%
- Google Android: 1,56%
- Outlook.com: 0.64%
- Thunderbird: 0.25%
- Samsung Mail: 0.15%
- Windows Live Mail: 0.05%
- QQ Mail: 0.05%
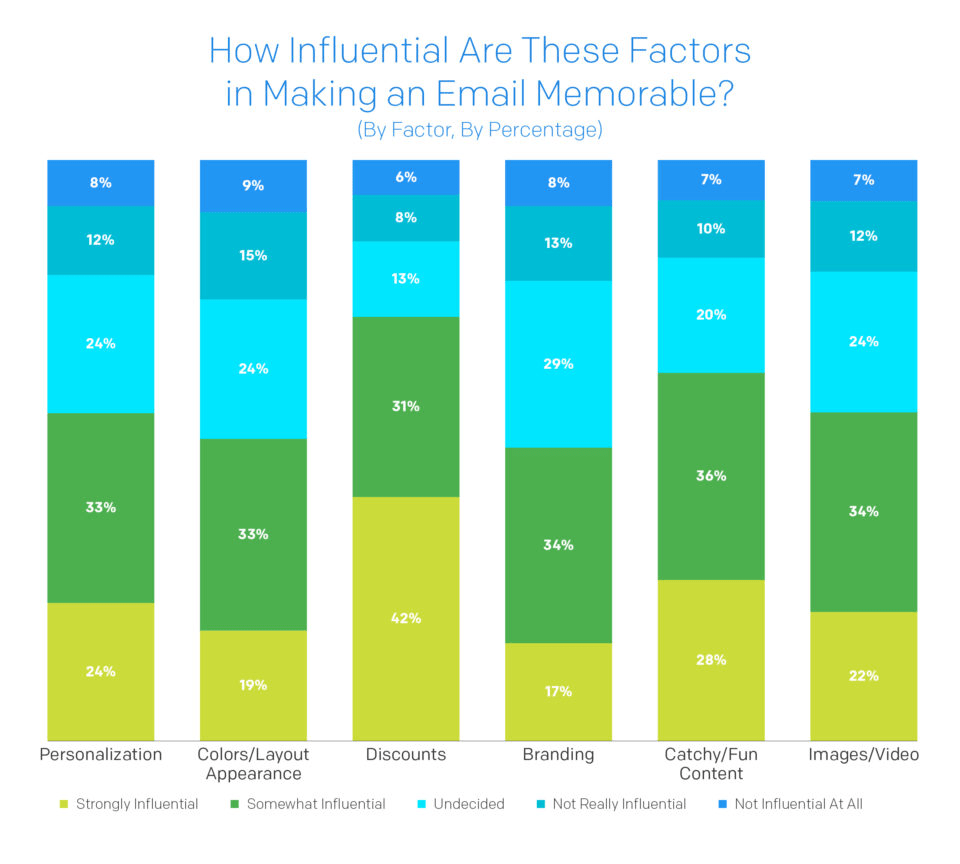
Global Messaging Engagement Report 2022 by Sendgrid
About data Sendgrid's Email (and SMS) Engagement Report is made up of both quantitative and qualitative data collected in Brazil, France, Germany, Japan, the UK and the USA. A 20-question questionnaire was sent to 800 people in each country, for a total of 4,800 respondents. Respondents were evenly distributed in each country across four age groups: Generation Z (18-24), millennials (25-35), Generation X (36-50) and baby boomers (51-65).
To access the report : https://sendgrid.com/resource/2022-global-messaging-engagement-report/
Key figures :
- 52% of respondents say they would unsubscribe if a company sent them emails every day.
- 20% hate to see grammatical or spelling errors in email boxes.
- 57% say that personalization would strongly or somewhat influence whether they find an email memorable.
- 43% of millennials say they are open to receiving a daily email from a brand, compared with only 35% for Generation Z.
The interesting statistic from the study: There's so much information in Sendgrid's study, it's hard to sort it all out. So we've chosen this graph, which asks what factors make an e-mail memorable. We can see that discounting continues to play a major role (73% of influence). What's also interesting to note is that the wording of the message, the fact that it's catchy and/or amusing, has an influence of 64%.
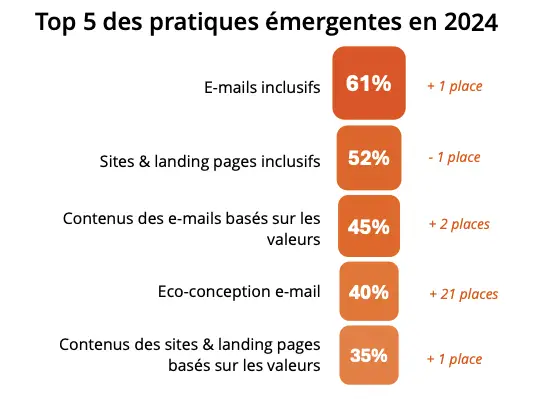
Email & Responsible Digital 2024 survey by Dolist
About data The survey is based on the responses of 277 decision-makers and operational staff who were questioned on subjects related to eco-design, accessibility and data minimization. They come from a wide range of business sectors, with an over-representation of communications agencies and companies with B2B targets.
To download the survey : https://www.dolist.com/ressources/guides-livres-blancs/enquete-email-numerique-responsable-2024/
Key figures :
- 79% of respondents say they have or want to act on theeco-design of their emails.
- 78% claim to have fully or partially integrateddigital accessibility to their emails
- 85% fully or partially implement a data minimization strategy
- 11% of respondents claim to have measured all or part of their the carbon impact of their e-mail campaigns
- 83% of respondents claim to have fully or partially implemented a strategy to reduce the number of marketing pressure.
Interesting statistics from the study: In this study of digital responsibility in France, we have selected two graphs that summarize the progression of practices compared to the same study 2 years earlier:

Deliverability barometers
A special category in this list of email marketing benchmarks since email deliverability is an important and very special topic in the world of email marketing. The word deliverability experts is relatively rare in in-depth studies. So make the most of it.
Email Deliverability Report 2023 by Validity
About data Validity's deliverability report unfortunately doesn't specify which data volumes the figures presented are derived from. All we know is that they are derived from the data generated by their deliverability monitoring toolnamely Everest.
Download the report : https://www.validity.com/resource-center/2023-email-deliverability-benchmark-report/
Key figures :
- Over 15% of legitimate emails (with consent) are not delivered to the inbox.
- Europe is the region with the highest inbox placement rate at 91%
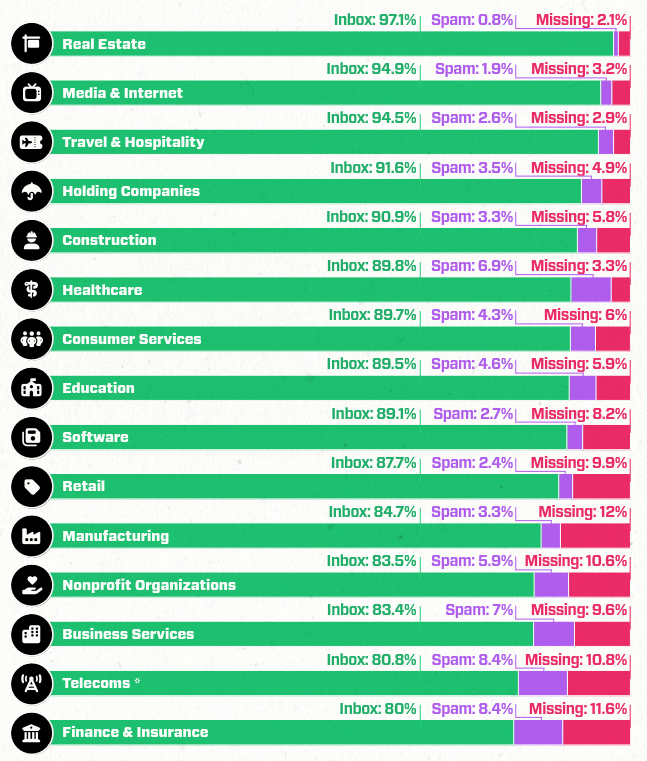
- 33% of emails sent by Business Services, Telecoms, Finance and Insurance are placed in spam boxes or are missing.
- MAGY" destinations (Microsoft, AOL, Google, Yahoo!) have a higher deliverability rate with 86%.
- Deliverability problems cost an average of $15,000 a year per million emails sent
The interesting statistic from the study: There are many statistics we could have highlighted, but once again we've opted for a sector-by-sector view. Even if we have to take into account the local specificities of deliverability, as destinations are not the same from one market to another. The two sectors with the best deliverability performances are real estate and media.
2nd quarter 2023 barometer by Signal Spam
About data Signal Spam publishes a quarterly barometer that summarizes the main findings of the spam complaints collected. For the second quarter of 2023, it is based on over 7 million reports. These data are almost exclusively French.
To access the barometer : https://www.signal-spam.fr/barometre/
Key figures :
- The most reported item is "Professionals, take advantage of free installation".
- 30% of spam comes from the USA, 23% from France
- 64% of alerts are marketing emails, 36% are cybercrimes
- The domain hosting the most phishing pages is storage.googleapis.com
Finally, about benchmark emails
The great challenge of this page on emailing barometers is to keep it up to date! So don't hesitate to call us to order on a regular basis. by contacting us. Don't hesitate to share your favorite emailing benchmarks in the comments, as they'll be a great way of enriching what's been set out above. In other news, the emailing consultants Badsender also carries out internal benchmarks for its customers within the framework of our emailing coachings and our emailing audits ! We look forward to hearing from you!
Leave a Reply